Smart Greenhouse Environment Control System
• Jiadong Song; Jiayong Hu; Jingwei Li; Yiqi Zhou
12740Final_Environmental_Control from jingwei on Vimeo.
0. Progress Reports
Progress Report4
Progress Report3
Progress Report2
Progress Report1
Progress Report0
1. Introduction
Our project is to use temperature and light intensity sensors to monitor and control the environmental factors in a greenhouse to make sure that they are in an appropriate range so the plants can grow fast with little human work.
1.1 Motivation
The greenhouse is one of the most important innovations to improve crop yield. Temperature and light intensity are two important environmental factors that affect the plants’ growth, which are also the factors we measure and control in this project.
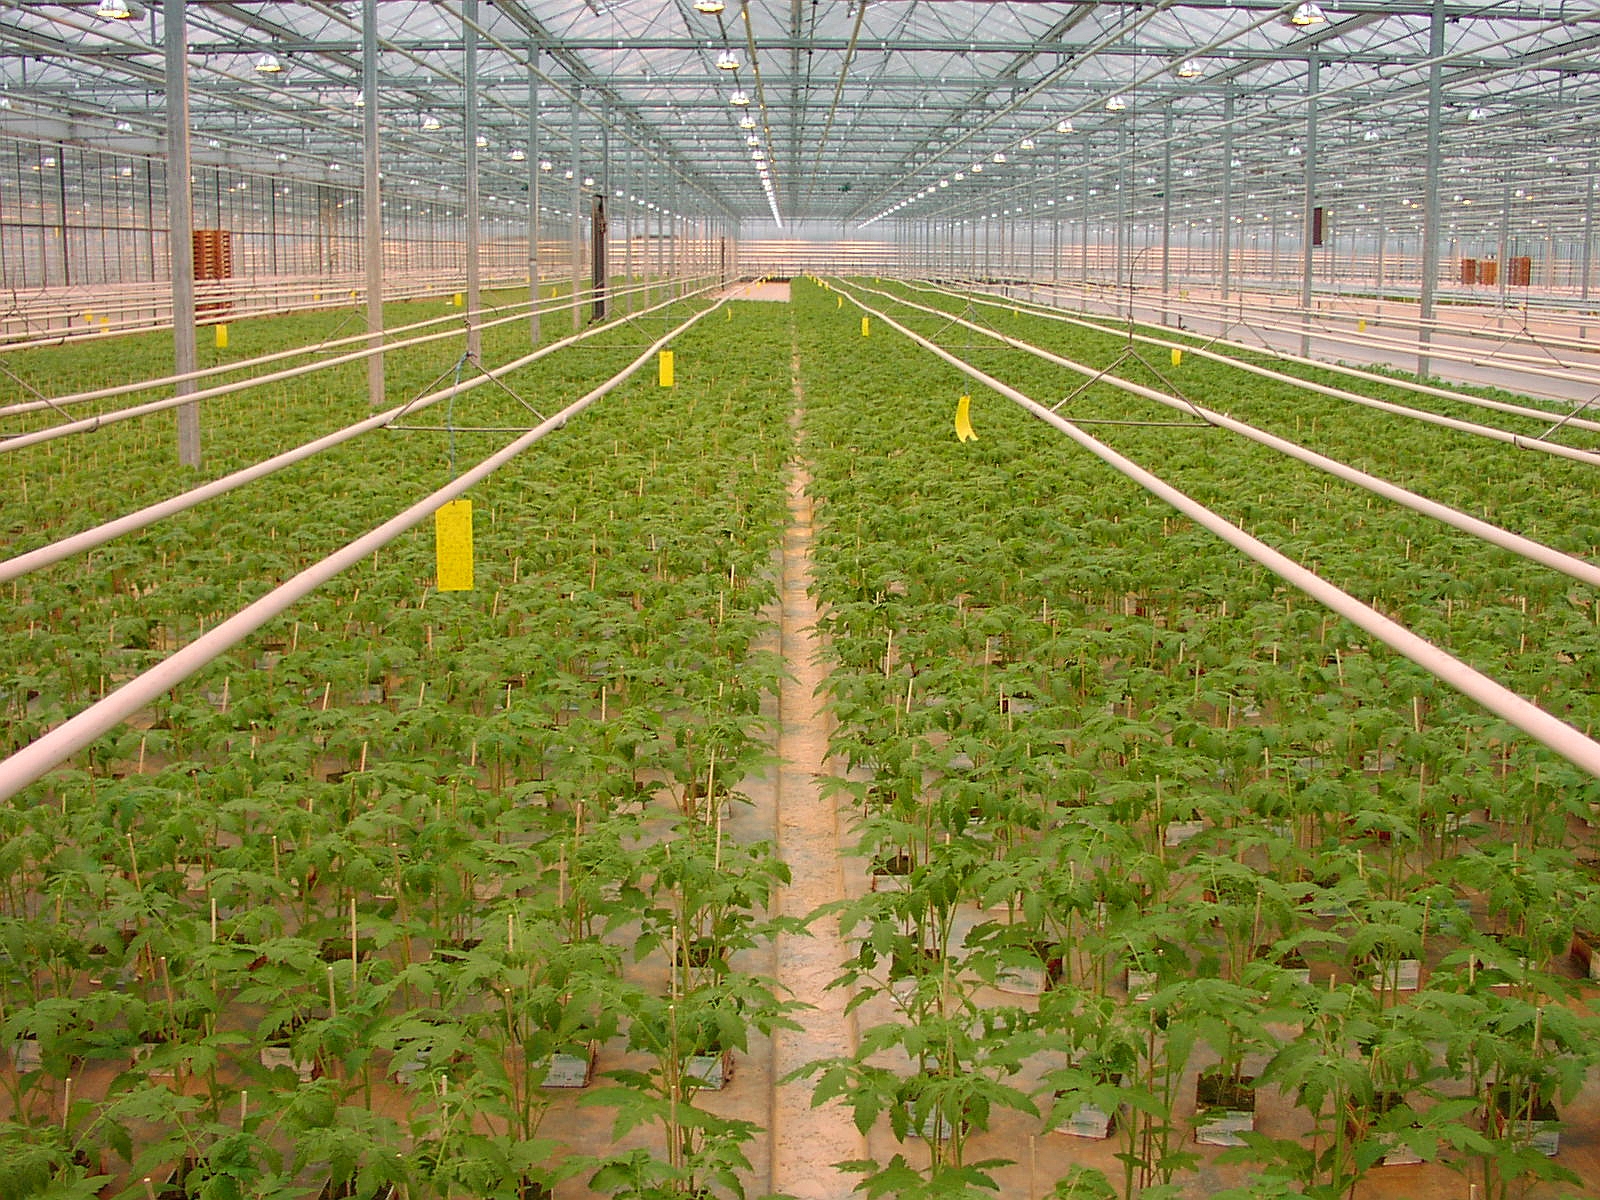
Figure1. Greenhouse
It is hard and time-consuming for people to monitor and control these factors manually. A lot of companies provide modern solutions for control system in greenhouse involving advanced equipment and machine learning methods. Our motivation behind this Smart Greenhouse project is to provide a simple and cheap solution for the greenhouse control system.
1.2 Goals
The goal of our system is to monitor the greenhouse environment and adjust the light and temperature automatically so that the plant is constantly absorbing light and in a convenient temperature range. Thus the crop yield can be maximized by ensuring the plant is always in a conducive growing environment while lowering the human effort required.
2. Methodology
2.1 Phenomena of Interest
The growth of the plant is mainly dependent on the temperature and light.
Light intensity is measured through illuminance, where lux are the units (equivalent to lumens per squared-meter). For reference, an office will normally have lux values between 320-500 lux.
Temperature is measured in unit of Celsius, where 0°C is the freezing point of water and 100°C is the boiling point of water.
2.2 Sensor(s) Used
We use DHT11 Temperature & Humidity Sensor Module and Photosensitive Light Sensor Module.
Temperature & Humidity Sensor Module
DHT11 Temperature-Humidity Sensor Module is a cheap and reliable sensor using an ADC to convert analog values of humidity and temperature. It comes with an 8-bit microcontroller and provides reliable output results.[2]
Parameters:
- Power supply: 3.3 - 5 V
- Current: 2.5 mA max use of current during conversion (when data request)
- Humidity: 20 - 90 % ± 5 %
- Temperature: 0 - 50º ± 2 %
- Sampling rate: ≤ 1 Hz

Figure2. Temperature sensor
Photosensitive Light Sensor Module
The Light sensor module is to detect the light intensity of the environment. The output voltage is related to light intensity based on the changes in resistance of the sensor which depends on light.[3]
Parameters:
- Working Voltage: 5V
- Output Signal: Analog or Digital(0 or 1)
- PCB Size: 3.2*1.4cm
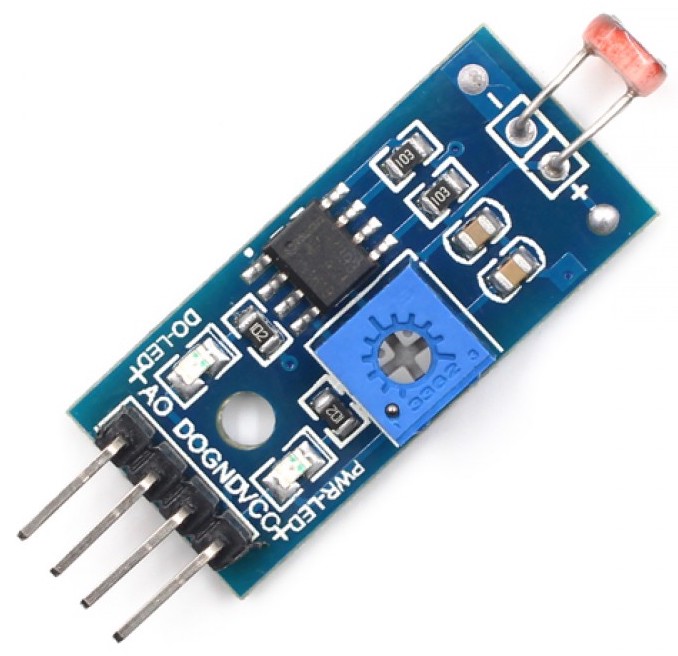
Figure3. Photosensitive light sensor
2.3 Signal Conditioning and Processing

Figure4. Greenhouse model
-
For the temperature part, we use two LEDs (Red/ Blue) as indicators of whether the temperature is above 28°C or not. The data acquired by temperature sensor is sent to Raspberry Pi and the python script will determine if it is cold or warm. Red LED means warm and blue LED means cold.
-
For the light part, we use 5 LEDs as our controller. These LEDs will help to generate extra light if the environment is not bright enough. The control method behind is PID. We collect the light intensity every iteration and based on the target value, we can calculate the error of light intensity. Then, we sum up all errors in history as the integral of error and subtract this error with last error to get the differential of error. We multiply them (error, integral, differential) with three parameters (P, I, D) to get the control variable. When we have the control variable, we adjust the duty ratio of the PWM wave to the LED, and the LEDs will respond with different intensity of light. After carefully tuning these parameters, we found the most suitable values for them, and we recorded the video with the best parameters.
3. Experiments and Results
3.1 Temperature indicator system
For temperature indication system, the humidity and temperature sensor measures temperature every 0.1s. We use two LEDs - one is blue and the other one is red as indicators. To simplify the problem, we assume that the best temperature for the plant is 28°C.
Normally, the red LED keeps lightened. If the temperature is lower than 28°C, the red LED will turn off and the blue LED will turn on, which indicates the greenhouse needs to be warmed up. In order to maintain the environment at the required temperature, a hair dryer is used to adjust the temperature in the greenhouse. After warming up, the blue LED turns off and the red one turns on again, which represents the ideal state for the growth of the plant is restored.

Figure6. Red LED indicates that temperature is above 28°C.

Figure7. Blue LED indicates that temperature is below 28°C.
3.2 Light control system
For the light compensation system, the light sensor measures light intensity every 0.1s. PID is used to control LEDs to provide extra light for the greenhouse system and keep the light intensity of the greenhouse at a stable value.
On sunny days, the external light is sufficient for the greenhouse and meets its needs. Therefore, the LEDs would not turn on.
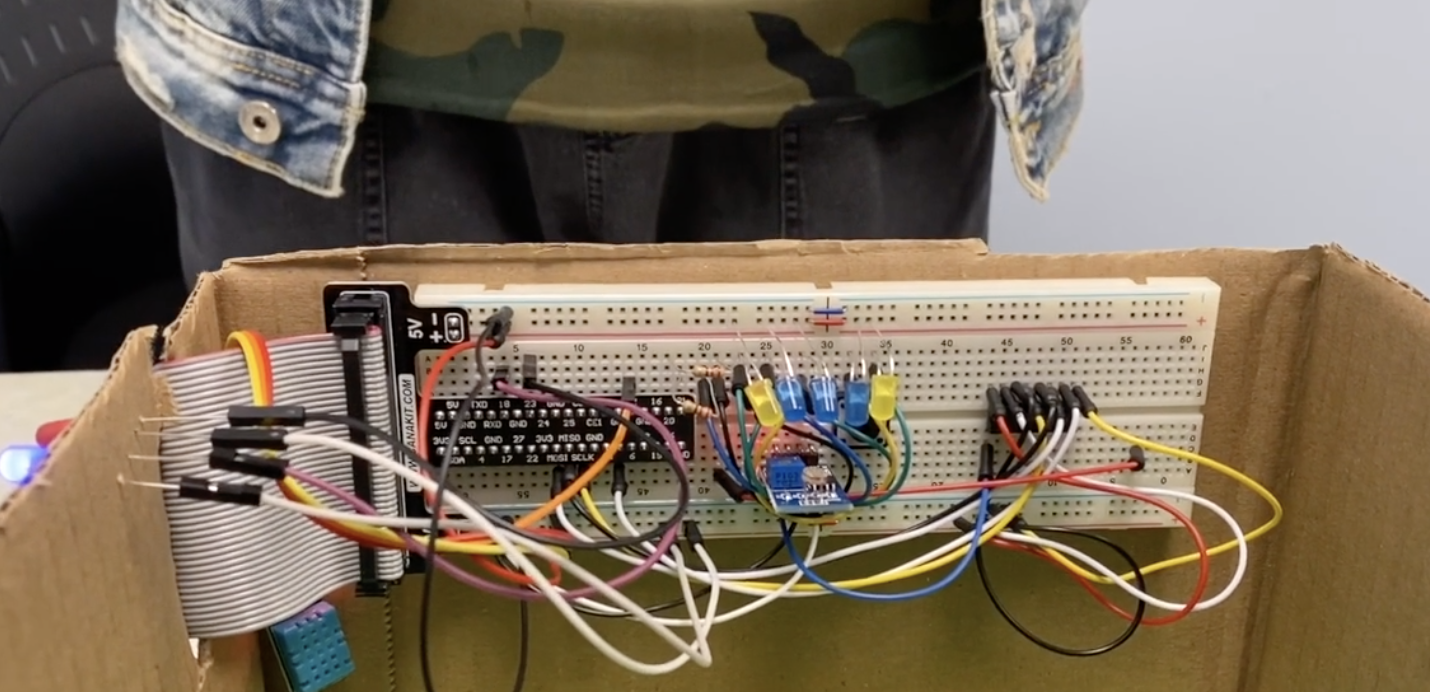
Figure8. LEDS on sunny days
On cloudy days, the external light is weakened and cannot meet the needs of the greenhouse. Hence, the LEDs would automatically turn on and gradually turn up to make up the required light intensity.
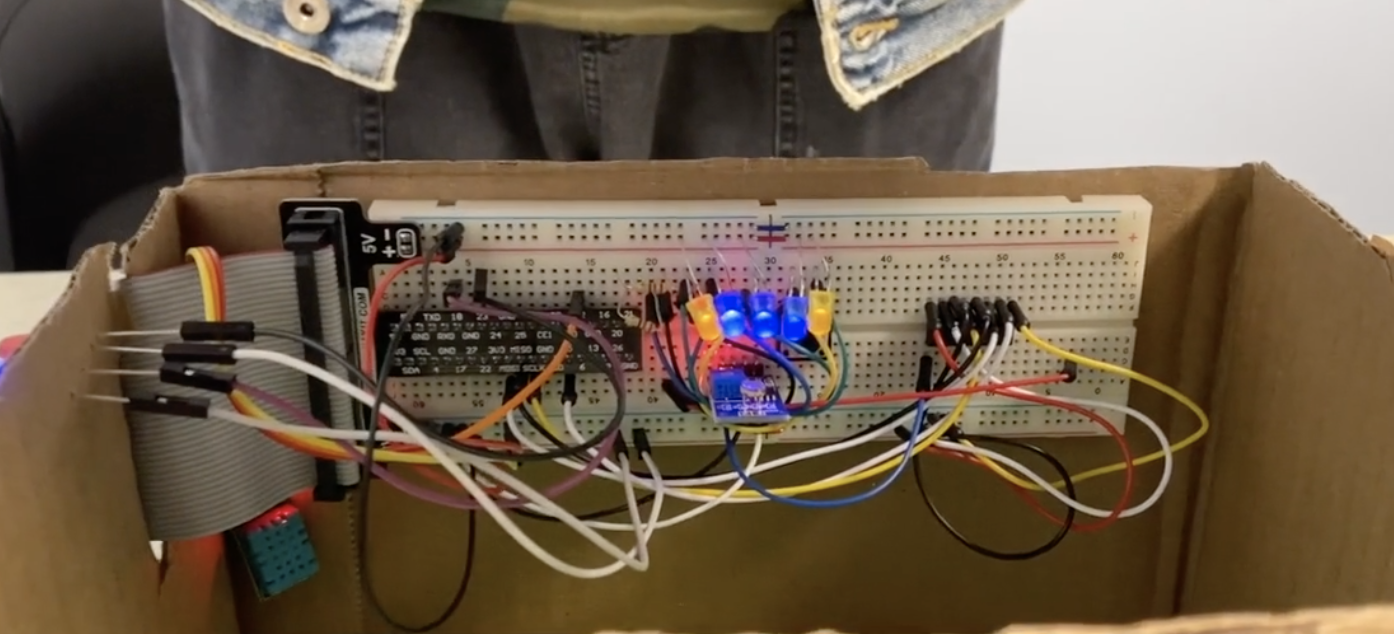
Figure9. LEDS on cloudy days
The LEDs would further enhance the brightness at night, that is, they would gradually turn up until the greenhouse has enough light intensity even though there is no external light at all. They would turn down again when the sun rises and turn off if light intensity meets the needs.
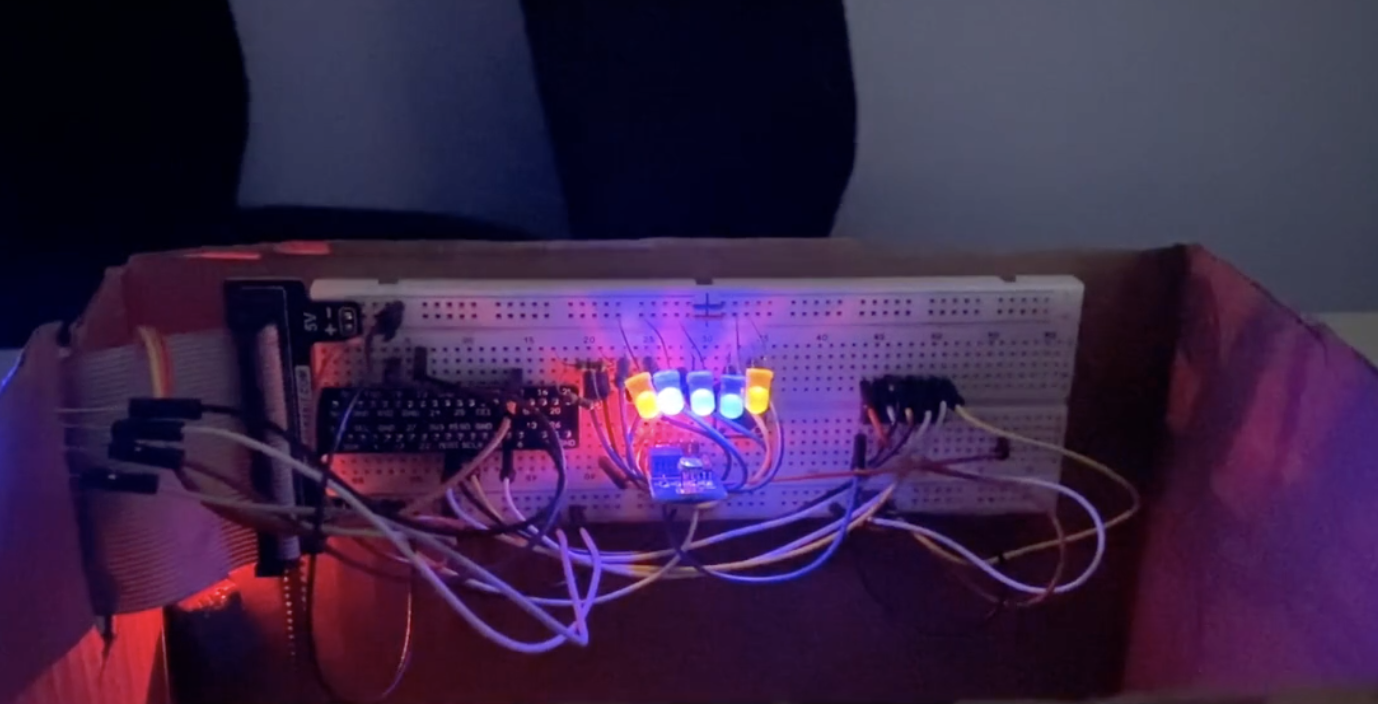
Figure10. LEDS at night
4. OpenChirp
We integrated our system to the OpenChirp so we can visualize the light intensity and the lightness of the LEDs. As the figure shows below:
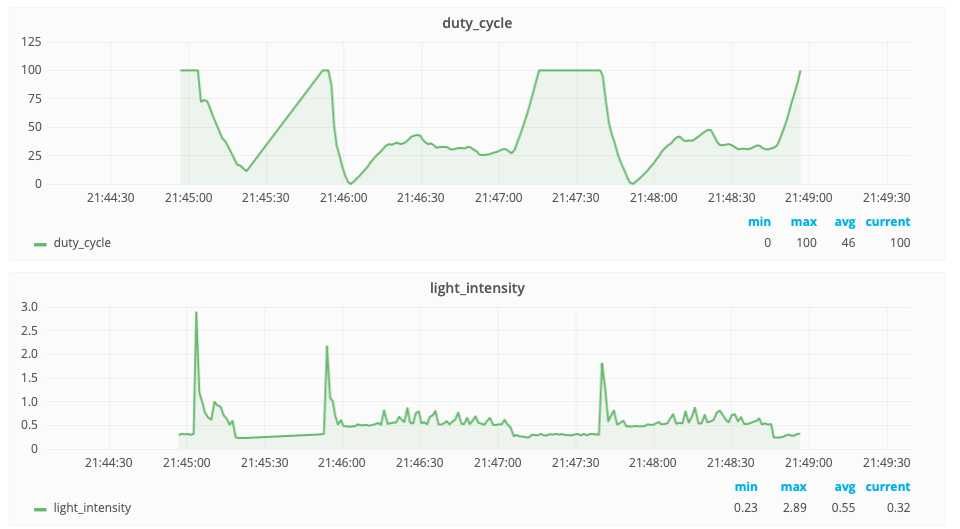
Figure11. Data visualization by OpenChirp
A duty cycle or power cycle is the fraction of one period in which a signal or system is active[4]. We use the duty cycle to represent the lightness of the LEDs. When the duty cycle is 0%, it means that the LEDs are fully lighting up, while the duty cycle is 100%, the LEDs are turned off and there is no light from the bulbs. And we represent the light intensity with voltage. The higher voltage of the circuit is, the darker is the environment. So we can see that at 21:45 the voltage jumped up which means we turned off the light and the system was in darkness, at this time, the LEDs were turned on gradually to make up the loss of the light intensity. And at 21:47, we turned on the lights, so the duty cycle of the LEDs increased gradually which means the bulbs turned off because there was enough light.
5. Discussion
How to control the temperature
For now, our system only indicates the temperature trend of the environment but does not achieve the real control of the temperature. So in the future, we can connect the system to a real temperature control system and use the PID control as well. For example, when the temperature is too high, the circuit would open the window or turn on the cooling system, else it would turn on the heating system to make the temperature consistent.
LEDs are not enough to keep the model in a proper lightness
In this project, our LEDs don’t seem to have enough lightness to keep the model in normal light, so our solution is to maintain the voltage at a relatively high level so the LEDs can make the PID control successfully. To improve performance, we will need more LED bulbs or brighter bulbs that can provide enough brightness.
Challenges of PID control
The challenges of PID control lie in the tuning of parameters. PID control is an easy and powerful algorithm, but parameter tuning is sometimes tricky, which could be very time-consuming.
How to apply our model to real greenhouses
In our project, we simplify and abstract a lot of the elements of the greenhouse. From the perspective of data acquisition, one sensor for each factor is apparently not enough. From the perspective of control, light and temperature adjustment are more complicated in real life. There is no fault tolerance of the system. Moreover, no actual plant is used in our project.
We used what we learned in the course and successfully implemented a smart greenhouse environment control system, but it still requires a lot of effort to apply the entire system of measurement and control into real greenhouses.
6. Code
7. Reference
[1] https://en.m.wikipedia.org/wiki/Greenhouse
[2] https://www.robotshop.com/en/dht11-temperature-humidity-sensor-module-dyn.html
[3] https://www.makerfabs.com/light-sensor-module.html
[4] https://en.wikipedia.org/wiki/Duty_cycle